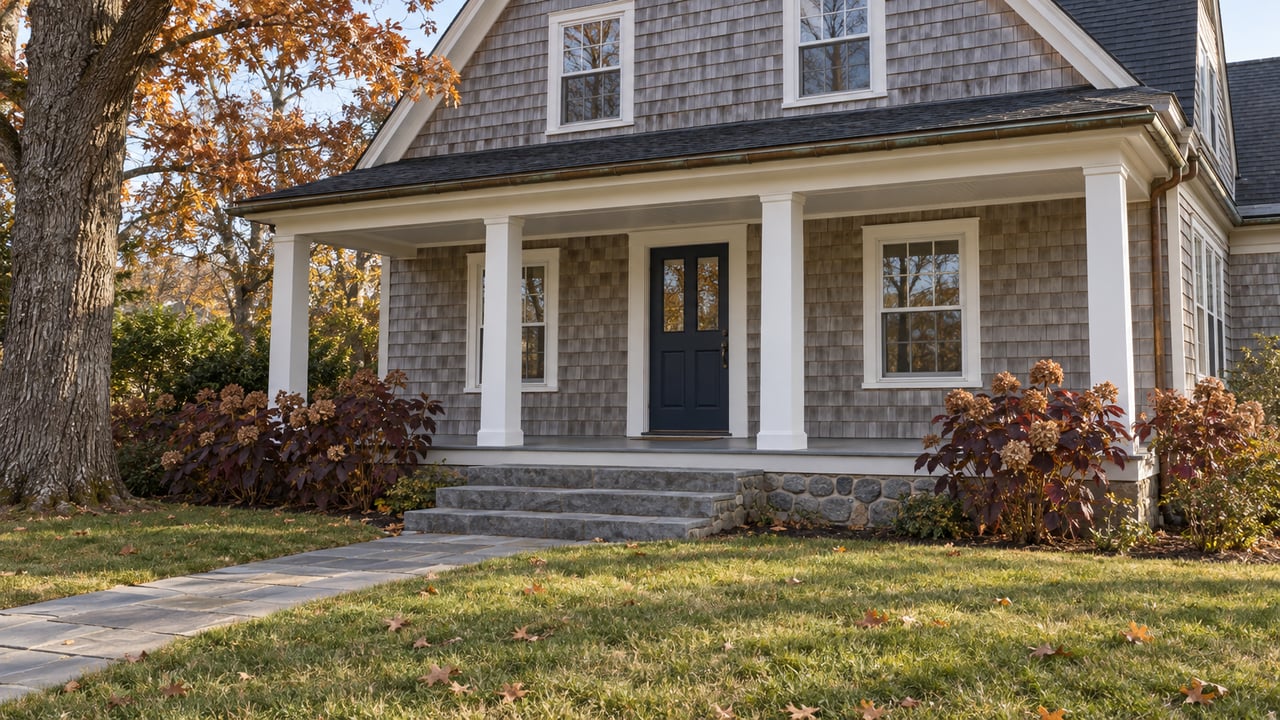
In early April 2026, an 1894 Victorian at 333 Sound Beach Avenue came on the market at $3.85 million, according to Greenwich Time. The house has 2,965 square feet on 0.34 acre, a wraparound porch and a two-car garage, and sits near the village, the train and Tod's Point. On July 31, the deed recorded a sale at $3,875,000, which was $25,000 over the asking price, per the assessor transfers published by Greenwich Free Press.
That closing was one of 13 single-family sales in Old Greenwich in July 2026. July 2025 had 8. In a year when most of Greenwich was short on homes to sell, Old Greenwich was the one part of town where listings and sales both rose. If you're comparing Greenwich neighborhoods this fall, the more useful questions are when that supply arrived and which kind of house it brought.
The Town Stood Still. Old Greenwich Didn't.
Here are the Greenwich Multiple Listing Service figures for single-family homes from January through September of each year:
| January–September | Old Greenwich 2025 | Old Greenwich 2026 | Town of Greenwich 2025 | Town of Greenwich 2026 |
|---|---|---|---|---|
| New listings | 76 | 89 | 535 | 530 |
| Sales | 51 | 61 | 393 | 380 |
Across Greenwich as a whole, new listings were flat and sales fell slightly. In Old Greenwich, new listings rose about 17% and sales about 20%. Old Greenwich's share of all single-family sales in Greenwich went from roughly 13% to 16% in nine months.
The townwide shortage was real. Writing in the Greenwich Sentinel on October 4, a local market columnist put Greenwich's inventory about 20% below 2025 levels for most of the year, until it jumped from 75 single-family listings at the end of August to 107 by the end of Labor Day week. The same column reported a September median of 17 days on market and 2.8 months of supply across town. Old Greenwich drew on the same buyer pool under the same conditions, but more homes came to market there.
The Sales Gain Came After June
Split Old Greenwich's year in half and the story changes. In the first half of 2026, Old Greenwich recorded 34 single-family sales, against 35 in the first half of 2025, so volume was flat. New listings were nearly flat too, at 61 against 59.
Most of the gap opened in the third quarter, and all of the gain in sales did. From July through September 2026, Old Greenwich had 28 new listings and 27 sales. In the same three months of 2025, it had 17 new listings and 16 sales. September carried the listing surge, with 16 new single-family listings against 11 a year earlier. That matches the post-Labor Day rush in the Sentinel's townwide count. Old Greenwich just took a bigger share of it.
So the "Old Greenwich is up" headline really describes one season. A buyer who searched hard in the spring and found little was not misreading the market. The extra homes arrived later.
Part of the Jump Is a Rebound
The 2026 third quarter looks strong partly because the 2025 third quarter was so weak. The GMLS table for Old Greenwich goes back to 2019. Here are third-quarter single-family sales for each year:
- 2019: 32
- 2020: 51
- 2021: 57
- 2022: 37
- 2023: 23
- 2024: 22
- 2025: 16
- 2026: 27
The 16 sales in 2025 were the fewest in the series, and September 2025 had just 2 closings. Measured against that, 27 looks like a 69% surge. Measured against 2023 and 2024, it is a modest step up. It is still below 2019, the last year before the pandemic surge.
The listing side shows the same pattern. Old Greenwich logged 89 new single-family listings from January through September 2026. The same months produced 144 in 2019 and 143 in 2021. Even after this year's gain, Old Greenwich put roughly 38% fewer homes on the market than it did in 2019. For a buyer, that means more choice than 2025 offered but far less than the village had before. For a seller, a few more competing listings than last fall is still well short of a normal supply.
Two Price Tiers That Behave Differently
When only a few dozen homes trade, the mix of what sold drives the averages. Old Greenwich's first half shows this clearly. The Greenwich Sentinel's first-half neighborhood analysis uses elementary school districts as stand-ins for neighborhoods. It found two fewer Old Greenwich sales than in the first half of 2025, but dollar volume up $40 million and the average sold price per square foot up $213 to $1,241, above the district that covers Belle Haven and Mead Point.
A large part of that came from one property. On January 20, 2026, 45 Binney Lane recorded at $27,800,000, with United Land & Building Development LLC as the seller, per Greenwich Free Press's transcription of town transfers. CT Insider described it as a waterfront Binney Lane property and the top Connecticut sale of the first half of 2026. When one sale of that size lands in a market with about three dozen closings in six months, it moves the dollar volume and the average price per square foot. It says very little about what a typical Old Greenwich house is worth.
The monthly medians swing the same way. Old Greenwich's March 2026 median was $8,225,000, set by two sales. The steadier figure is the year-to-date median through September 2026, which was $3,525,000, compared with $3,002,500 for all of 2025 and $2,100,000 for all of 2019. Townwide, the year-to-date median through September was $3,600,000.
The third-quarter closings show how differently the two tiers behave. Here are two from the same summer:
| Property | Description | Asking price reported | Recorded sale |
|---|---|---|---|
| 333 Sound Beach Avenue | 1894 Victorian, 2,965 sq ft, 0.34 acre, near the village and train | $3.85 million, April 2026 | $3,875,000, July 31, 2026 |
| 189 Shore Road | Greenwich Cove peninsula home, 4,262 sq ft, 0.68 acre, private dock access | $10.95 million, March 2026 | $7,950,000, September 3, 2026 |
The village Victorian recorded slightly above its asking price about four months after listing. Greenwich Time reported the Shore Road listing at $10.95 million in March, and the deed recorded $7,950,000 in early September. Both sales are consistent with how Old Greenwich's year played out. Homes near the village with a clear set of comparable sales traded near their asking prices. Waterfront properties, which have fewer true comparables, were priced one house at a time.
Reading Old Greenwich Against the Town Numbers
Townwide reports are where most buyers and sellers pick up their sense of the market, so it helps to know how Old Greenwich lines up with them. The Greenwich Association of Realtors' third-quarter update reported 150 townwide single-family closings in Q3 2026, against 161 in Q3 2025. It put the median sale price at $3,368,790, up 10.5% year over year, and average days on market at 38, down from 56. For September 2026 alone, the association's monthly release showed 38 closings, a $2,942,500 median, 124 active listings at month end, and sellers receiving 104.9% of list price on average.
All of those figures describe the whole town, and the townwide count of sales fell. Old Greenwich went the other way, with sales up from 16 to 27 in the same quarter. A buyer who reads "Greenwich sales down 7%" and expects slim pickings in Old Greenwich is a season behind. A seller who reads the 104.9% figure as a promise for every Old Greenwich house is applying a townwide average to a market that, in 2026, priced village homes and waterfront homes on separate terms.
What sets the odds for a specific house is where it sits:
- Village-area homes have a dense set of recent comparable sales, so pricing can be checked against closings on nearby streets, as with 333 Sound Beach Avenue.
- Waterfront and peninsula properties have few comparables, and a single sale like 45 Binney Lane can move the neighborhood averages without saying much about the next waterfront listing.
- Timing within the year mattered more in 2026 than the annual totals show. Most of Old Greenwich's added supply came after June, and the busiest stretch for new listings was September.
A Few Common Questions
Is Old Greenwich's 2026 sales increase a lasting trend? The GMLS figures through September 2026 show a rebound from the lowest third quarter in the 2019 to 2026 series. They do not yet show a return to 2019 levels. Listings from January through September were about 38% below the same months of 2019.
Why did Old Greenwich's average price per square foot jump so much in the first half? The Greenwich Sentinel's first-half analysis reported a $213 increase to $1,241 per square foot, during a period that included the $27.8 million recorded sale at 45 Binney Lane. With so few sales, one large waterfront sale has an outsized effect on averages like that.
Is the Old Greenwich median higher than the town's? Through September 2026, the year-to-date single-family median was $3,525,000 for Old Greenwich and $3,600,000 for the Town of Greenwich, according to GMLS tables.
If you own in Old Greenwich and are deciding whether to list this fall or wait for spring, the useful comparison is your house against the closings on your own streets and in your own tier, not against the townwide median. Joshua Weisman can walk you through where your home sits among this year's Old Greenwich sales. Start with a free home valuation.